Amarna is a theoretical history consultancy and research company. It provides advice and solutions in the areas of strategy, intelligence,
forecasting and communication. This website showcases the growing precision and predictive power of socio-historical models thanks to better theory, new data and the tools of complexity science.

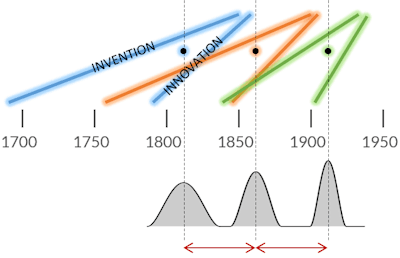
The economy advances through a series of S-curves in which successive inventions take off exponentially then reach saturation...

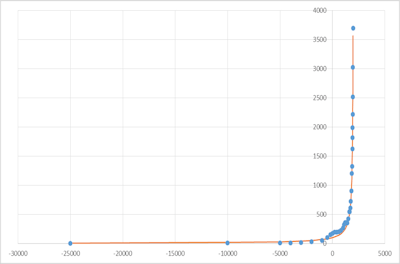
Global growth has followed a hyperbolic curve that can be precisely modelled with just a few simple assumptions...

Outbreaks of revolution and civil war can be predicted by a Political Stress Index that is based on three key variables...

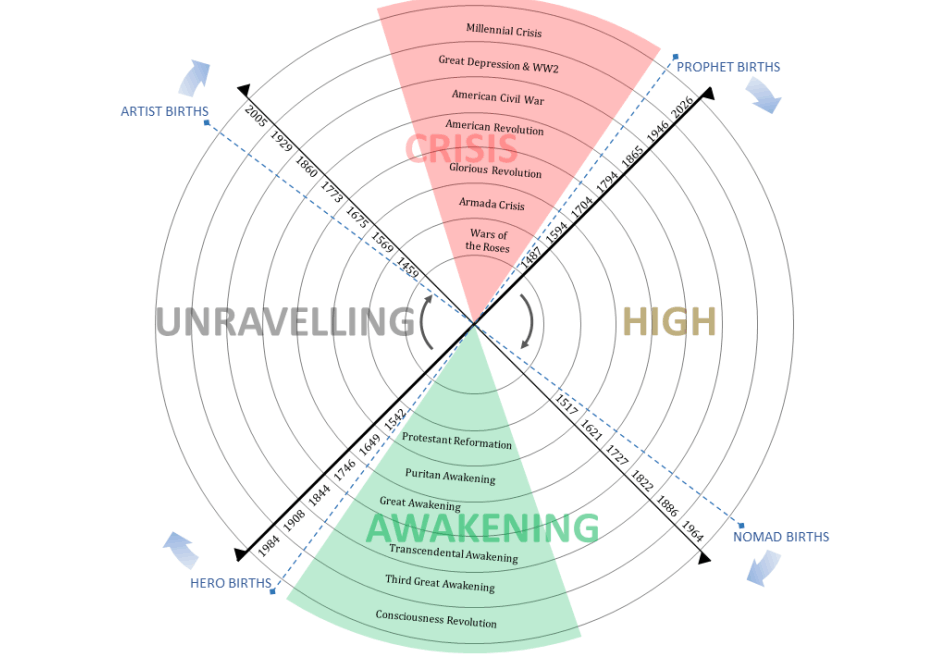
People's attitudes and life experiences fall into four generational archetypes, which depend on the timing of their birth relative to political and cultural crises...

The rise of a challenger to the world's leading nation results in recurrent episodes of global war...

Ruling dynasties rise and fall in a regular pattern marked by fluctuations in social cohesion...

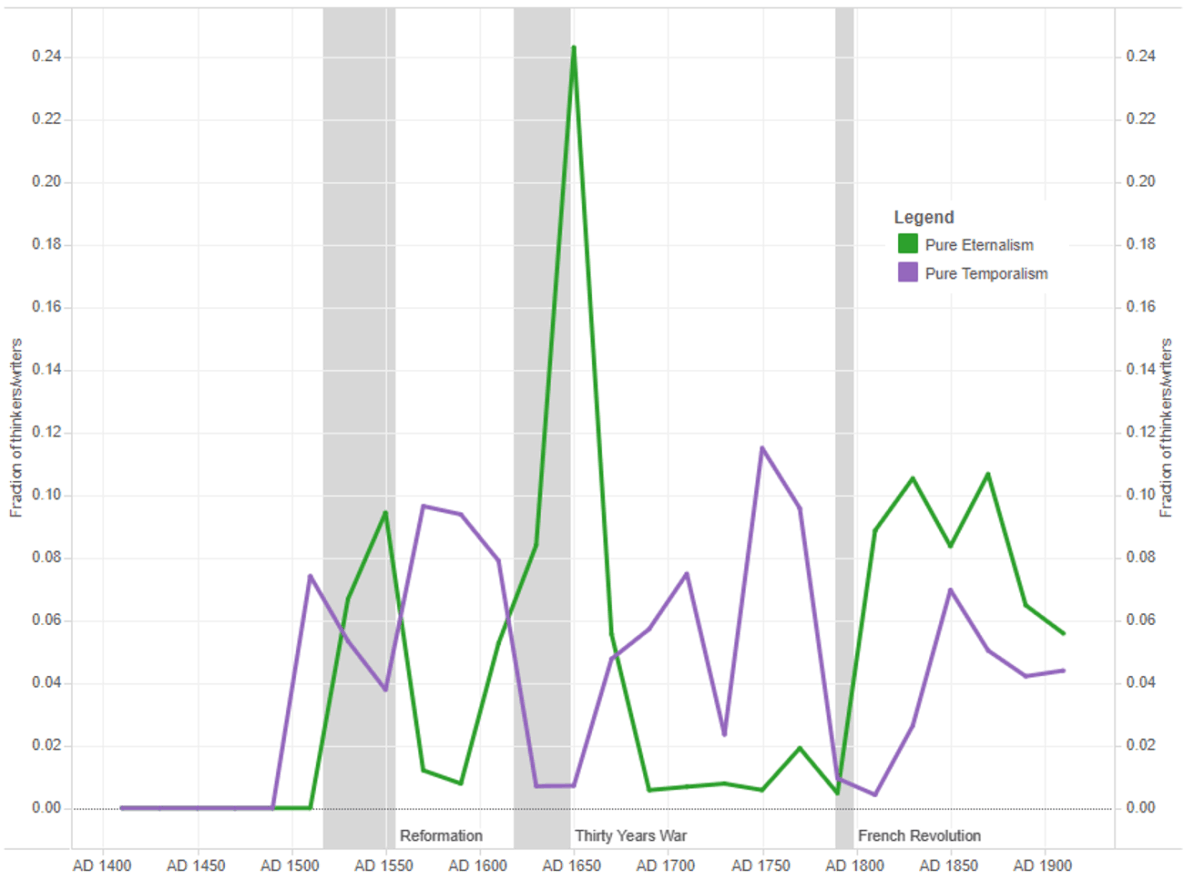
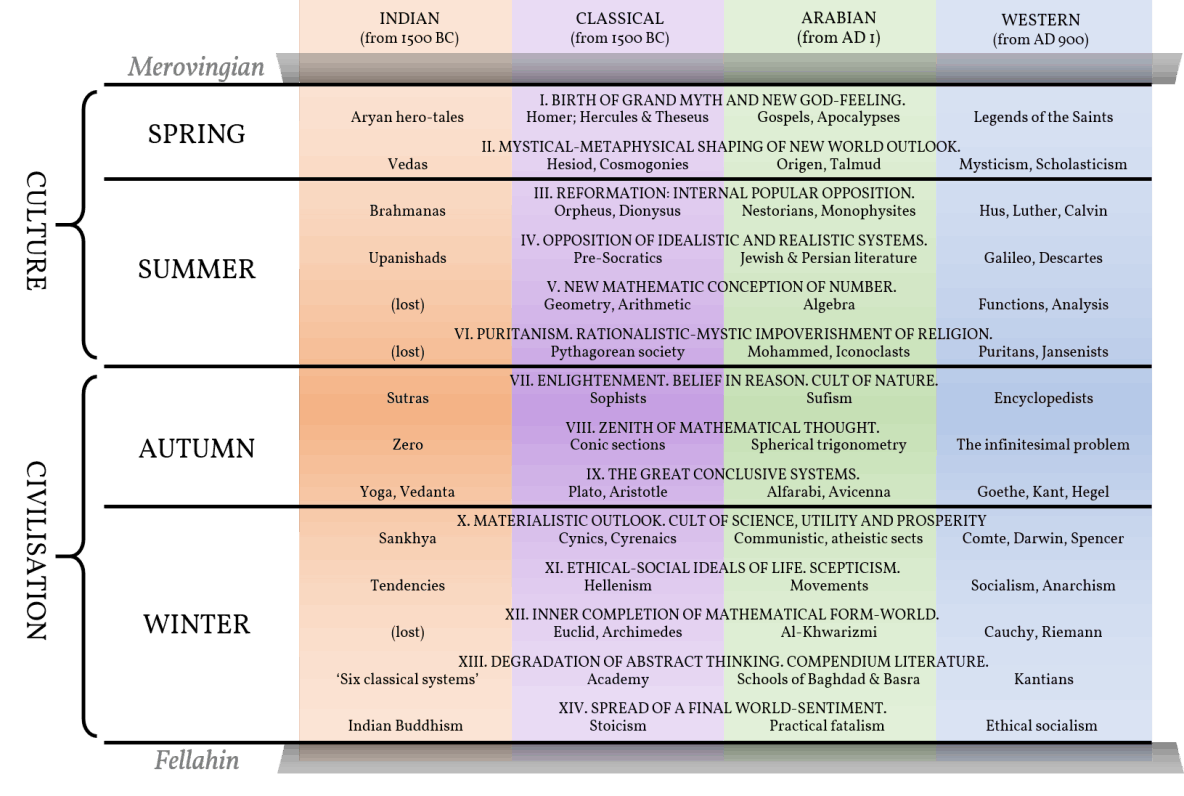
There are centuries-long swings in the fundamental beliefs that permeate every aspect of a society's art, religion, literature, science and philosophy...
The world's civilisations are at differing stages of their evolution and have differing potentials for further growth and development...

Civilisations pass through three and a half boom-bust cycles, while the initial creative minority gives way to a dominant minority and invasion of the external proletariat...

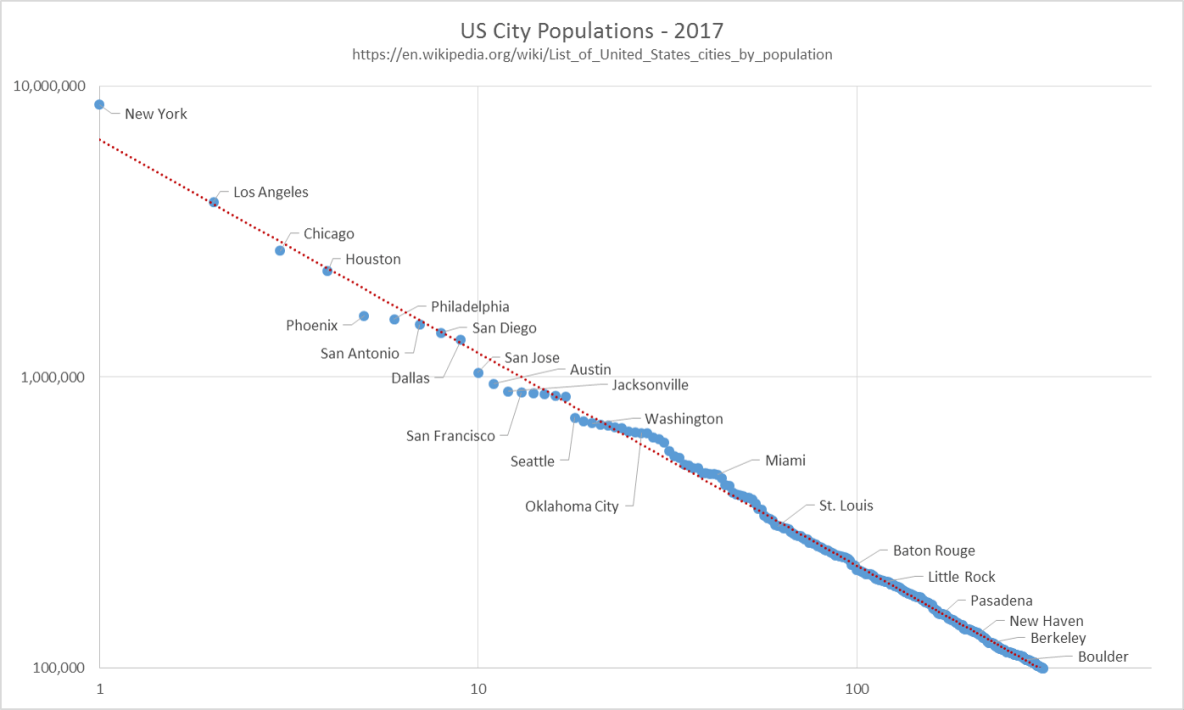
Many sociological variables, such as the sizes of cities and intensities of wars, exhibit highly regular and predictable statistics...

The properties of cities, such as how many pharmacies they contain or their total economic output, exhibit surprising regularities that can be explained mathematically...

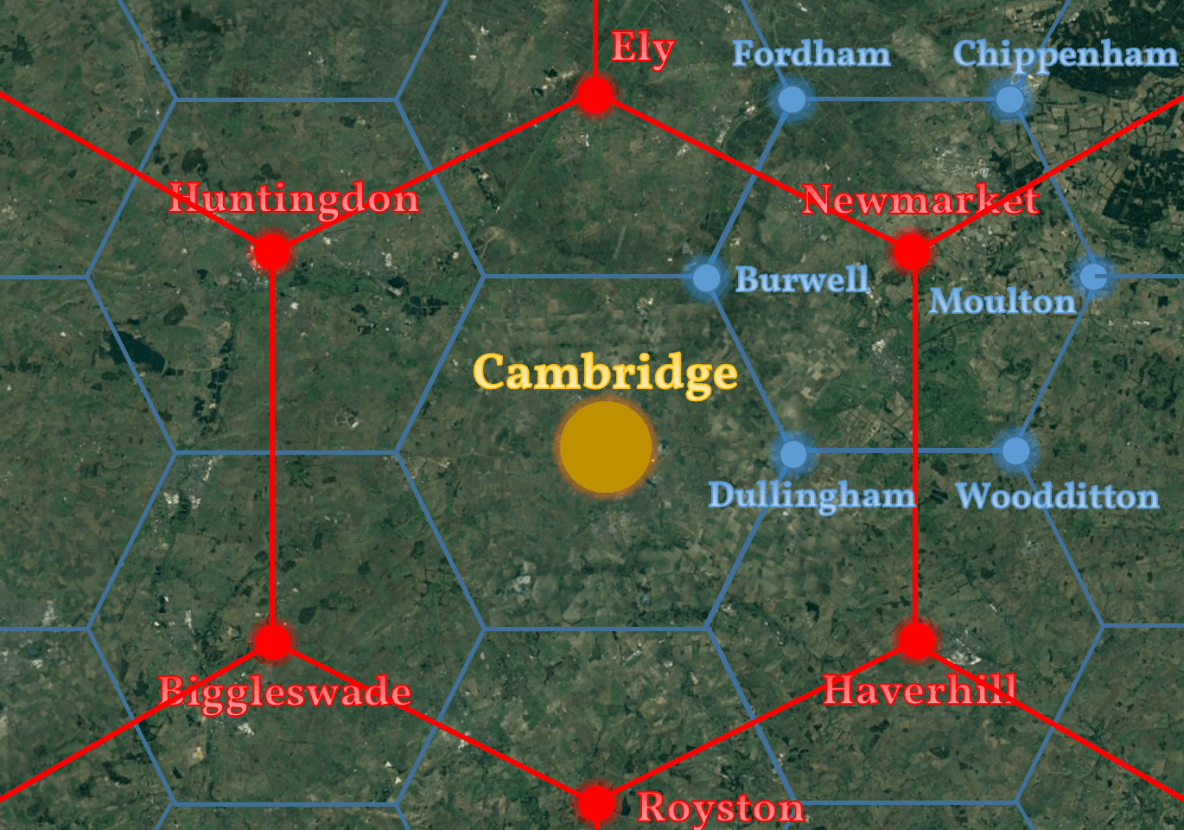
Urban settlements cover the landscape in semi-regular patterns that arise from their economic, communicative and administrative functions...

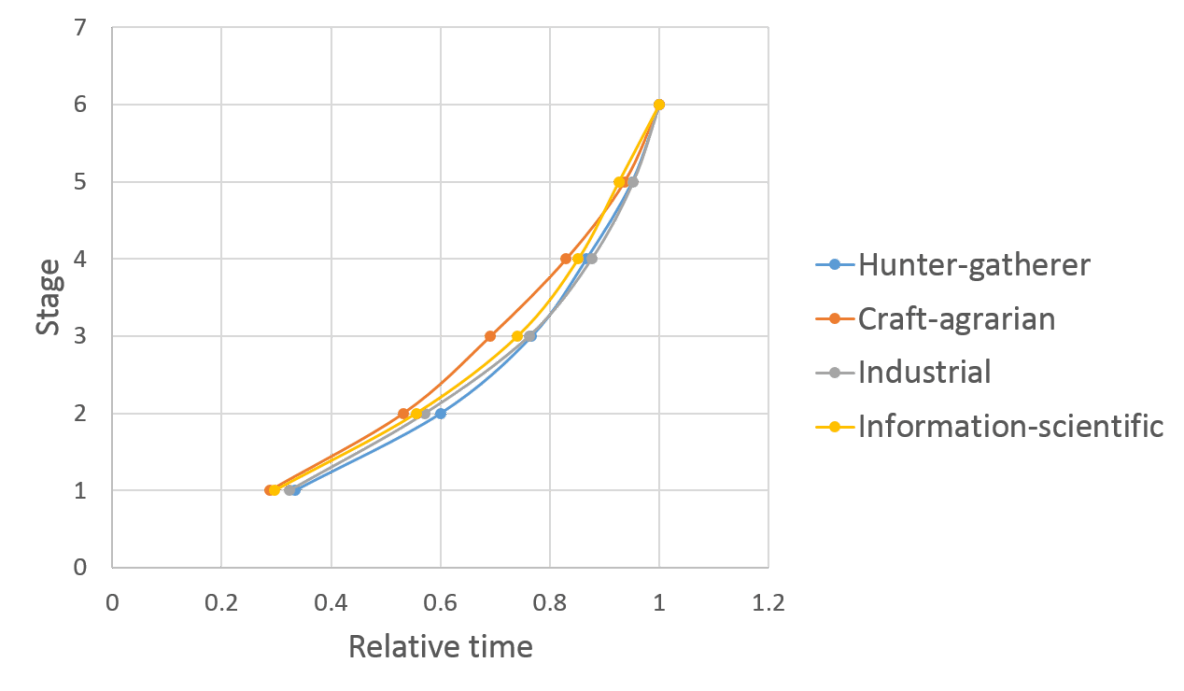
Global social evolution exhibits four great techno-economic phases, each of which has passed through the same six stages...

Capitalist economies exhibit approximately 60-year waves of growth and recession that are linked to innovation and military conflict...

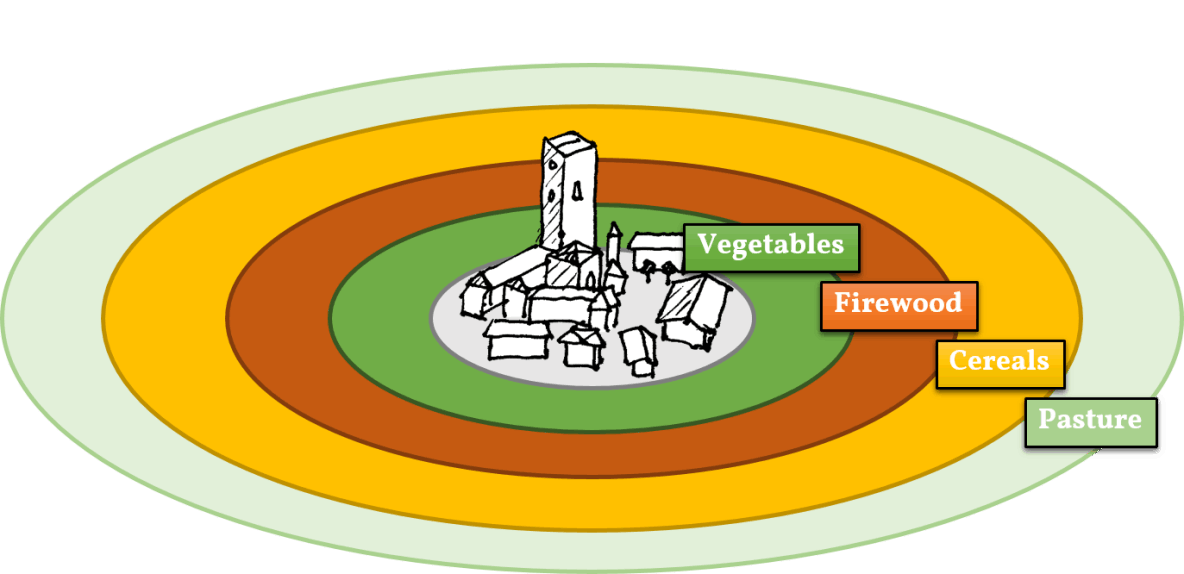
Market centres, whether villages, cities or countries, are surrounded by theoretically predictable zones of differing economic production...

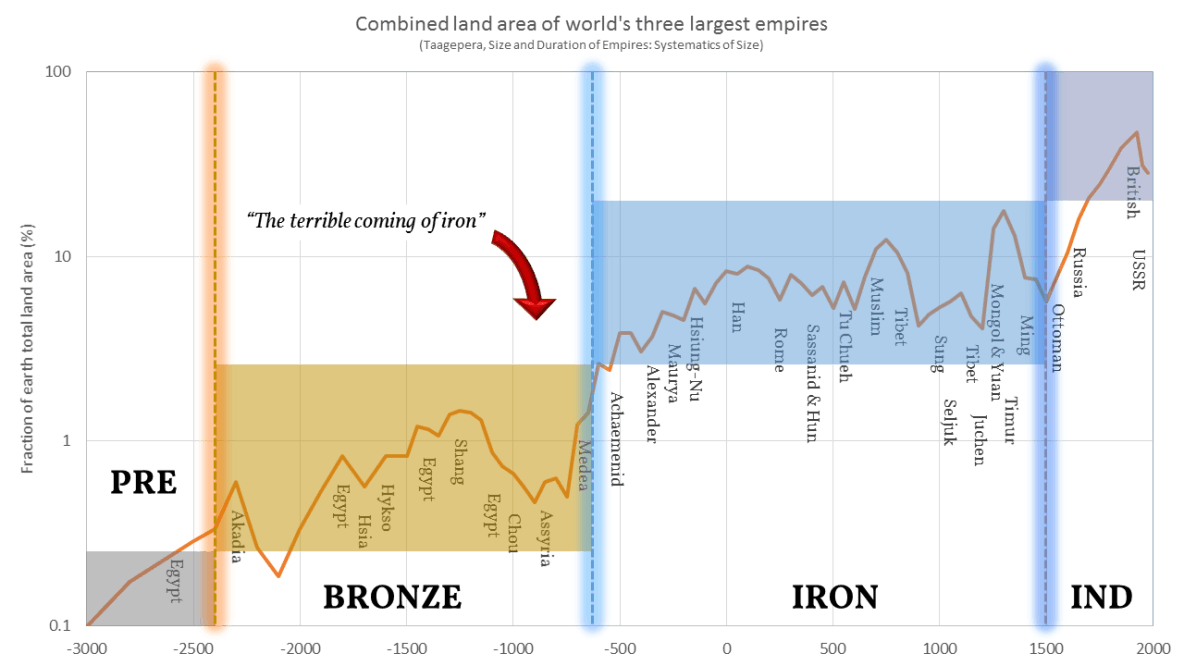
The size of empires has increased in a consistent way that points to the attainment of a world government several centuries from now...

Political hierarchies have three basic components whose relationship determines overall stability...
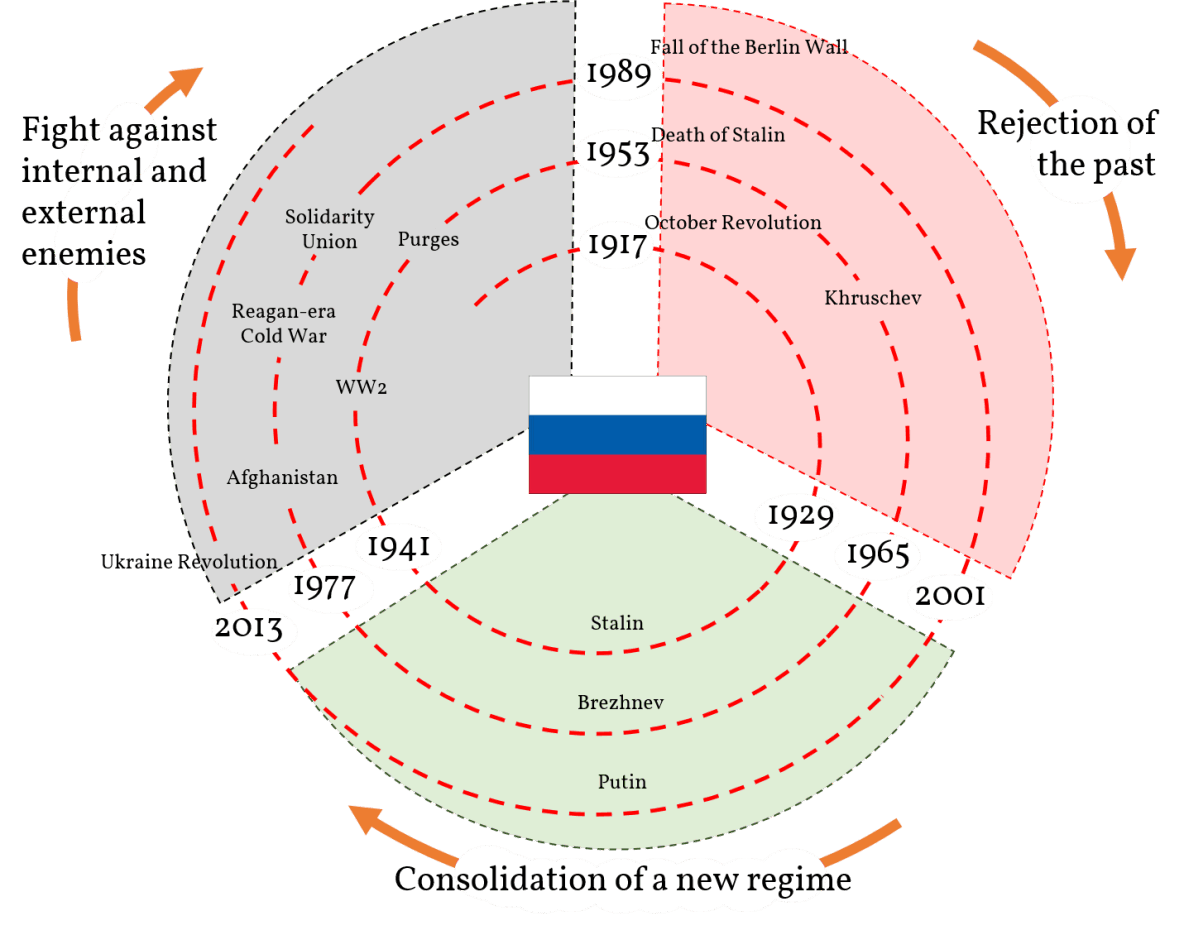
For over a century, Russia's political history has followed a highly regular cycle of 36 years divided into three phases of 12 years each...